|
In order to determine an appropriate gear ratio to successfully
climb the ramp, we wrote an excel spreadsheet that allowed us to
input geometry, mass position, motor specifications, ramp slope, and
other important variables. It output for us the percentage of the
maximum power used, whether the wheels would slip or if the cart
would tip over, and the amount of time it takes for the transporter
to reach the top of the ramp.
Some screen shots of the spreadsheet (Click to enlarge):
We used the program throughout the design process to help us check to see whether our design would work successfully. After we finished building, we input the final geometry values and then tried to optimize the percentage of the maximum motor power used and climb time by adjusting the gear ratio. Our design of a gear box connected to two outer gears allowed 18 different gear ratios. According to the program, only 3 of these would provide enough torque to carry the transporter up the ramp. We graphed these three combinations to visualize the optimal solution. Graph of the maximum motor power used and time for the transporter to climb the ramp versus the three gear ratio possibilites (Click to enlarge):
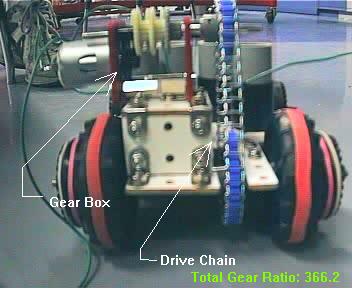
The obvious optimal solution was a gear ratio of 162.8. It was the most efficient use of the power provided by the motor and it made the transporter climb the ramp in the least amount of time. We used this as our gear ratio in one of our earlier models, but it just did not provide enough torque to climb the ramp. Our final version uses a gear ratio of 366.2, which was the least optimal of all the solutions, but turned out to be the only one that worked. Our program either simplified the problem to an extent of being of inaccurate, or our transporter was much more inefficient than we expected it be.
|
||
|
|